My Kinect Lab viewer could already open a saved point cloud from an Xbox One Kinect v2 and let me inspect the scene from somewhere other than the sensor’s viewpoint. I had brought the sensor back to life on my Apple Silicon Mac in the first article. Now I wanted to keep that scene moving while the Kinect was connected.
I had the pieces: a Rust capture application, a C++ bridge to libfreenect2-metal, and a Svelte interface around Three.js. In the previous article, a file separated capture from display. Live viewing removed that comfortable pause between the two. The interesting problem arrived before I had a cloud to send to the browser: my background capture thread crashed inside Cocoa.

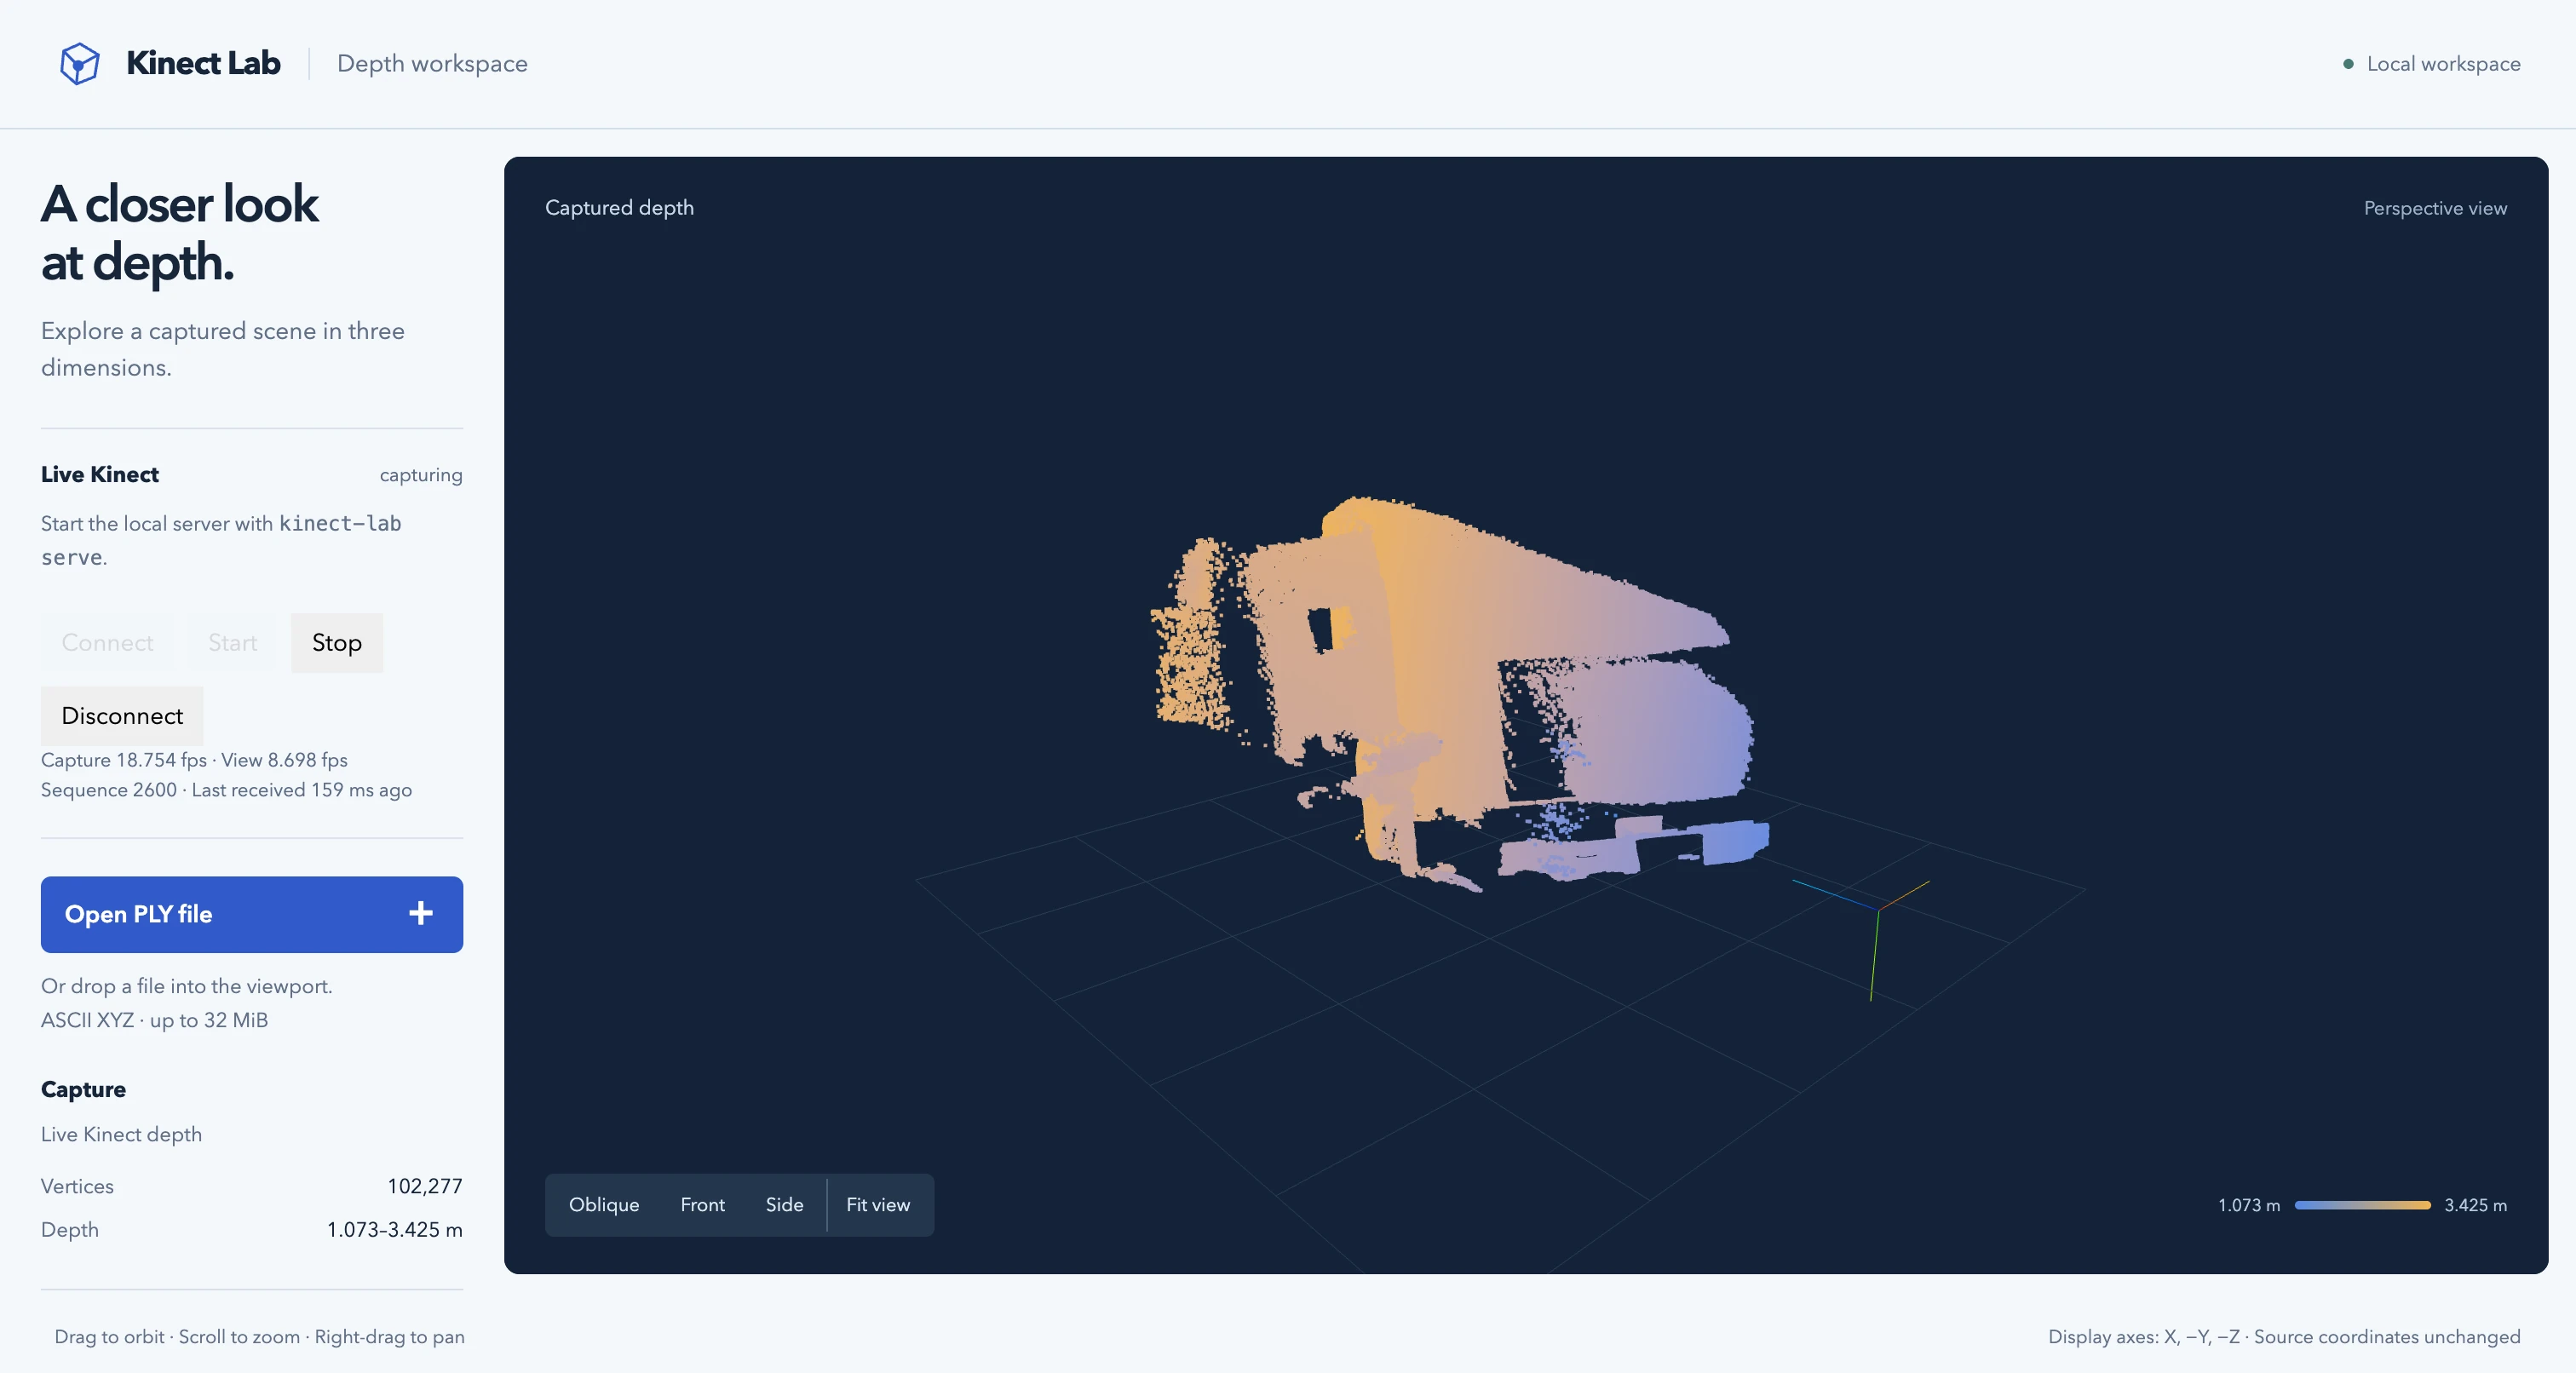
A real live capture from 2 November, after the thread correction. The depth colors are not RGB. The counters belong to that early debug run, before the later USB lifecycle checks. On mobile, two crops from that same screenshot show the controls and cloud separately. Open the full capture.
As checked on 3 November 2026, the public repository’s tip is
77e746b, with the offline viewer introduced at
acdbf1b. The live implementation is still an uncommitted
local working version on top of that code. The live excerpts below come
from that working version; the capture wrapper is already public.
The crash before the first cloud
Putting capture on a background thread seemed a reasonable place to start. Waiting for a depth frame is blocking work; the HTTP server should remain available while that happens. The capture object could be constructed and used entirely inside its worker, without moving the native handle between threads.
That still left a constraint I had missed.
The saved macOS crash report from 2 November records SIGTRAP and this
diagnostic:
NSUpdateCycleInitialize() is called off the main thread.
Reading the crashing thread’s stack led from Capture::open through the C
ABI’s kl_open into MetalPacketPipeline. From there it went through
construction of the TurboJPEG RGB processor, WithPerfLogging, glfwInit
and _glfwInitCocoa, ending in NSApplication and NSUpdateCycleInitialize.
The RGB processor was particularly revealing. My bridge requests depth streaming with RGB disabled, but constructing this pipeline still constructs an RGB processor. Disabling a stream does not remove every initialization dependency associated with it.
The driver’s timer constructor explains the GLFW call. This is the complete constructor, with indentation preserved:
  Timer()
  {
#if defined(LIBFREENECT2_WITH_OPENGL_SUPPORT)
    glfwInit();
#endif
    reset();
  }
My installed build has OpenGL support enabled as well as Metal. The timer introduces this initialization dependency even when the selected depth backend is Metal. In that build, creating the pipeline reached GLFW’s Cocoa backend from the wrong thread. GLFW documents initialization as a main-thread operation.
That is the scope of the diagnosis. I did not establish a general rule that Metal work must run on the main thread. I found a specific native initialization path in this driver build, supported by its source and the crash stack. I have kept the original report; the failed background-thread version is not a committed revision I can ask a reader to check out.
The marker was already there
The capture wrapper has carried its thread marker since the first commit. It was already there when the background version crashed. This is the complete struct, also present in the public capture source:
pub struct Capture {
    handle: NonNull<c_void>,
    // Driver control and process-wide signals belong to one thread. Prevent
    // both Send and Sync, even if pointer trait defaults change.
    _thread_bound: PhantomData<Rc<()>>,
}
The Rc marker prevents the wrapper from being Send or Sync. But it
doesn’t say which thread may construct it. A worker can create a non-Send
object and keep it for its entire lifetime. That was enough to preserve
ownership while still calling Cocoa from a thread Cocoa would reject.
Send describes whether a value can cross thread boundaries;
Sync describes whether references can be shared safely between
threads. Neither trait selects the process’s main thread for a native
function call. The application has to place that call where the foreign API
expects it.
An Arc around the handle would not change those requirements. Nor would a
mutex: serialized calls can all happen on the wrong thread. Also, wrapping a
non-Send value in Arc<Mutex<_>> does not make it transferable. The
standard library’s thread-safety discussion makes the distinction
between shared ownership and the safety of the contained value explicit.
I kept the capture object on the process main thread and moved the network runtime away from it. That gives the native initialization the thread it needs, while keeping the handle on that same thread through acquisition and cleanup. This is an application-level placement decision; the marker alone does not enforce it.
Moving the server instead
In serve, a spawned thread builds a Tokio runtime with two network worker
threads. The original thread then calls the capture worker directly. This
excerpt is the actual call, not another spawn:
    live::worker(
        live_capture::open,
        Capture::process_interrupted,
        shared.clone(),
        rx,
        shutdown,
    );
The worker owns the source it opens. The source trait has no Send bound;
the network side receives shared state and a bounded command sender, never
the capture handle. Start and Stop travel through a command channel with
capacity one. If it is full, the request fails explicitly and restores the
previous state rather than leaving the UI waiting for an unqueued command.
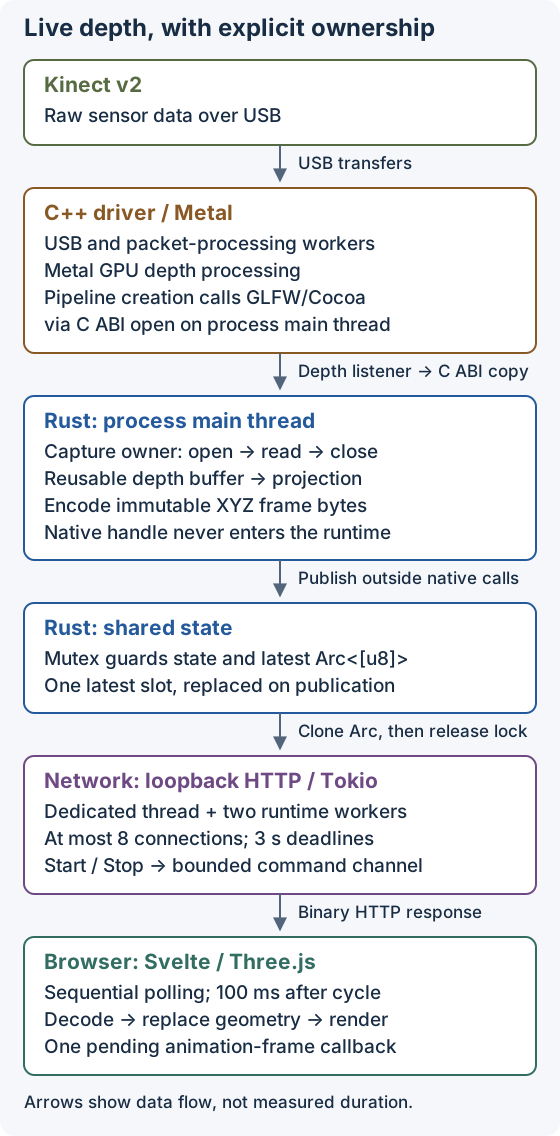
The main-thread box describes my application’s native calls and Rust work. The driver still has its own USB and processing workers, and Metal executes depth processing on the GPU. Moving the server does not move those internals onto the main thread.
For each iteration, the source calls next_depth with a 200 ms wait timeout
and a reusable Rust pixel buffer. The C++ bridge copies a valid depth frame
and releases the driver’s frame before returning. Rust then runs the same
calibrated projection used for offline export and encodes the resulting XYZ
coordinates for transport. Acquisition, projection and encoding are
sequential on this main-thread path, outside the shared-state mutex.
There is no extra projection worker in this version. I wanted a running system whose ownership I could follow before adding another handoff.
The live payload is binary: an eight-byte KLCLOUD1 identifier, sequence
number, point count and arrival timestamp, followed by little-endian float32
XYZ triplets. The header is 24 bytes; at the sensor’s maximum point count,
the complete message is bounded at 2,605,080 bytes. Both encoder and decoder
check their limits. This avoids generating and reparsing an ASCII PLY for
every live update, while preserving PLY as the offline input.
A slow viewer should skip ahead
For live inspection, I want the next available view of the room. A growing queue would give me an increasingly old room instead.
The transport is loopback HTTP polling, with Hyper serving
127.0.0.1:8765. There is no WebSocket in this implementation. The shared
state contains one latest encoded frame as an Arc<[u8]>. Publication
replaces that slot. A request clones the Arc under the mutex, then sends
the immutable bytes without holding the lock during network I/O.
The critical assignment in State::publish is small. This excerpt is inside
the generation and capturing-state guard:
            self.first_published.get_or_insert(now);
            self.latest = Some(bytes);
            self.frames += 1;
            self.published = Some(now);
An in-flight response can retain an older allocation while capture replaces the latest slot. So “one latest frame” does not mean exactly one allocated frame in the whole process. The server also caps active connections at eight and gives each connection a three-second deadline, including response writes. Those bounds keep slow clients from retaining an unbounded history.
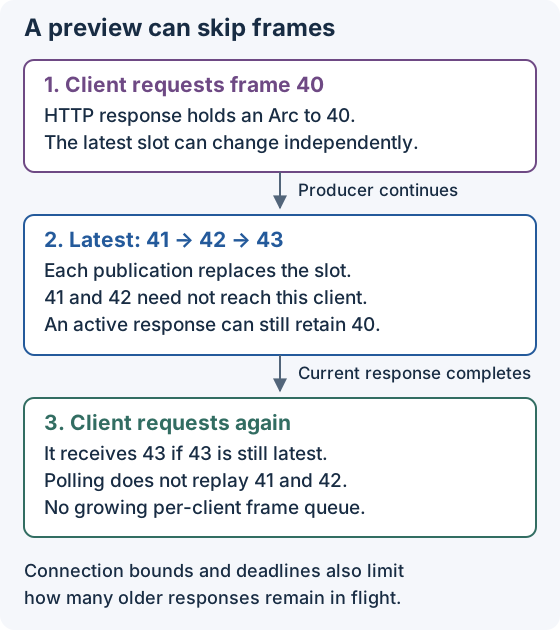
An ordering example, not a timing measurement. Replacing the slot releases its old reference; bytes still owned by an active response remain alive until that response releases them.
The browser requests status, then a frame when capture is active. It waits for those operations to finish before scheduling the next poll 100 ms later. It ignores a repeated sequence number. That prevents overlapping polling cycles, but also deliberately limits the rate of distinct cloud updates. The work and request time come on top of that 100 ms pause.
Three.js still schedules rendering through requestAnimationFrame, with
only one render callback pending at a time. Each nonempty live cloud
replaces the previous geometry and disposes its GPU resources. The first
nonempty frame fits the camera; later ones preserve my viewpoint so I can
orbit while the sensor keeps capturing. An empty cloud updates the live
counters but leaves the last nonempty geometry visible.
Frames overwritten before a client requests them are intentionally skipped. Recording every frame would need a different contract.
Four buttons, two different connections
The distinction between connecting to the server and opening the Kinect is visible in the controls:
| Control | Effect |
|---|---|
| Connect | Obtains a local API session and starts status polling. It does not open the sensor. |
| Start | Requests capture. On the main thread, the bridge opens the device and starts depth streaming, then Rust reads its calibration. |
| Stop | Invalidates publication for that capture generation and requests native stop and close. The last cloud stays visible. |
| Disconnect | Cancels polling, rejects delayed results and sends a best-effort Stop request. It does not wait for a close acknowledgement. |
The server exposes opening, capturing and stopping, as well as idle
and error. An accepted HTTP command is not a completed hardware operation.
For example, a Stop received while opening prevents that generation from
publishing, but it cannot interrupt the native open call halfway through.
The worker processes cleanup when control returns to it.
Status and frame requests refresh a shared three-second lease. If the browser disappears without delivering Stop, the worker closes the source after that lease expires and its loop next checks it. This is one lease for the server, not an independent capture session per tab. Another polling client can keep it alive; one client’s Stop affects the shared sensor.
Errors remain part of that lifecycle. If acquisition fails and close also
fails, the worker retains both errors. A close failure does not turn into an
idle success merely because the picture stopped changing.
That mattered during the first real run, which streamed successfully but
failed during USB shutdown and then failed to reopen. Those were the
historical results. Since then, I have proposed a USB lifecycle fix
upstream from my driver fork. On 3 November, a C++ test harness
using the installed patched Metal library completed ten open/stream/close
cycles on the Aukey hub, with 30 frames per cycle. A script then drove three
Start/frame/Stop cycles against the live API. Each received a binary cloud
and returned to idle with no error.
The fix is public in a913cbf, with regression coverage and
diagnostic follow-ups in the same PR. As checked on 3 November, PR #32 is
open, not merged. Its diagnosis deserves a separate article. Here, the
important update is that the observed close/reopen failure is corrected in
the setup I am now using. Broader USB testing remains separate work.
What the counters actually measured
The first browser run on 2 November used the debug application build on my M4 Pro with the Metal driver. Six samples over a 30-second window reported 18.469 to 18.933 published clouds per second and 8.570 to 8.644 distinct cloud deliveries per second to the viewer. The screenshot was taken separately during that session, so its counters differ slightly.
The UI labels these “Capture” and “View” FPS, but their implementations have
narrower meanings. The server counts completed publications after
projection and encoding. The browser counts distinct sequences delivered
to onFrame. Both rates are cumulative averages, starting at the first
publication or first distinct browser receipt in the current run. Reading
them several times late in a long session gives closely related averages,
rather than independent measurements of throughput over each interval.
The browser counter counts deliveries; completed GPU draws need separate
instrumentation. Camera interaction can also render without another cloud.
The newer hardware checks give me a useful comparison, provided I keep their workloads separate:
| Observation | Conditions | What it establishes |
|---|---|---|
| 29.89 depth frames/s over 62.279 s | 3 November, debug CLI, M4 Pro, Aukey hub, patched Metal driver, 1,861 frames | Sustained depth delivery with clean close, without live projection or browser display |
| 26.04 to 30.23 publications/s | Three short live API cycles driven by a script on 3 November, debug app, installed patched Metal driver | Script received clouds and Stop completed cleanly; each average covers only 45 or 46 publications |
| 8.570 to 8.644 distinct viewer deliveries/s | Initial 2 November debug browser sampling | The browser’s observed update delivery rate in that session |
The CLI’s elapsed time is its reported capture interval, not the complete process wall time. Its run still recorded startup sequence gaps. The driver also reported packet loss during the initial browser session; the later investigation found that a sequence-gap counter alone cannot distinguish transport loss from processing backpressure.
The 100 ms pause alone sets a nominal ceiling of ten polling cycles per second; request and processing time lower it further. The observed rate of about 8.6 deliveries per second fits within that policy. Before looking for a slow stage, I need to account for the waiting I put there myself.
The missing experiment is a controlled 60-second live browser run with the corrected driver, followed by a release comparison. I would record acquisition and publication intervals separately, time projection and encoding, then instrument browser receipt and render callbacks against a stable workload. A sensor-to-screen latency measurement would also need a defined timing protocol beyond the packet’s arrival timestamp. The existing CLI and short API runs verify different parts of the path; their workloads and durations give me no basis for attributing a speedup to the USB fix.
Opening a saved scene during capture
Opening a PLY during a live session disconnects the viewer and sends a best-effort Stop request for the shared sensor, targeting capture for all clients. Both inputs reach the same scene loader, so orbit controls and display settings still work on a saved capture. Client generation checks reject a delayed live response after disconnection; file-read generation checks keep an older pending file read from replacing a newer selection. Connecting also invalidates a pending offline read.
Checking the live path
The current checks cover binary framing, malformed inputs, sequential polling and delayed responses after disconnect. Rust tests exercise stale publication, lease expiry, command-queue rollback and combined acquisition and cleanup errors. During preparation of this article, all 46 Rust tests and 15 frontend tests passed on this working version.
The recorded browser checks used both a real Kinect stream and an explicitly synthetic source. The synthetic source made lifecycle and navigation cases repeatable without claiming to reproduce USB behavior. The saved PLY still lets me investigate a particular scene without another capture.
I now have a moving cloud I can look around while the Kinect runs. The surprising part was how early the thread decision had to be made: before the native handle existed, inside initialization I was not calling directly. The main thread owns that part of the application now. Across the network, I share the resulting bytes and let an old preview go. I would rather miss an intermediate cloud than carefully display where my hand used to be.
Comments, questions, or just a reaction?
Send an email to ~bounga/bounga.org-discuss@lists.sr.ht. It is public and archived, so other readers can follow along and answer too.